Primary and Final Energy
Primary Energy

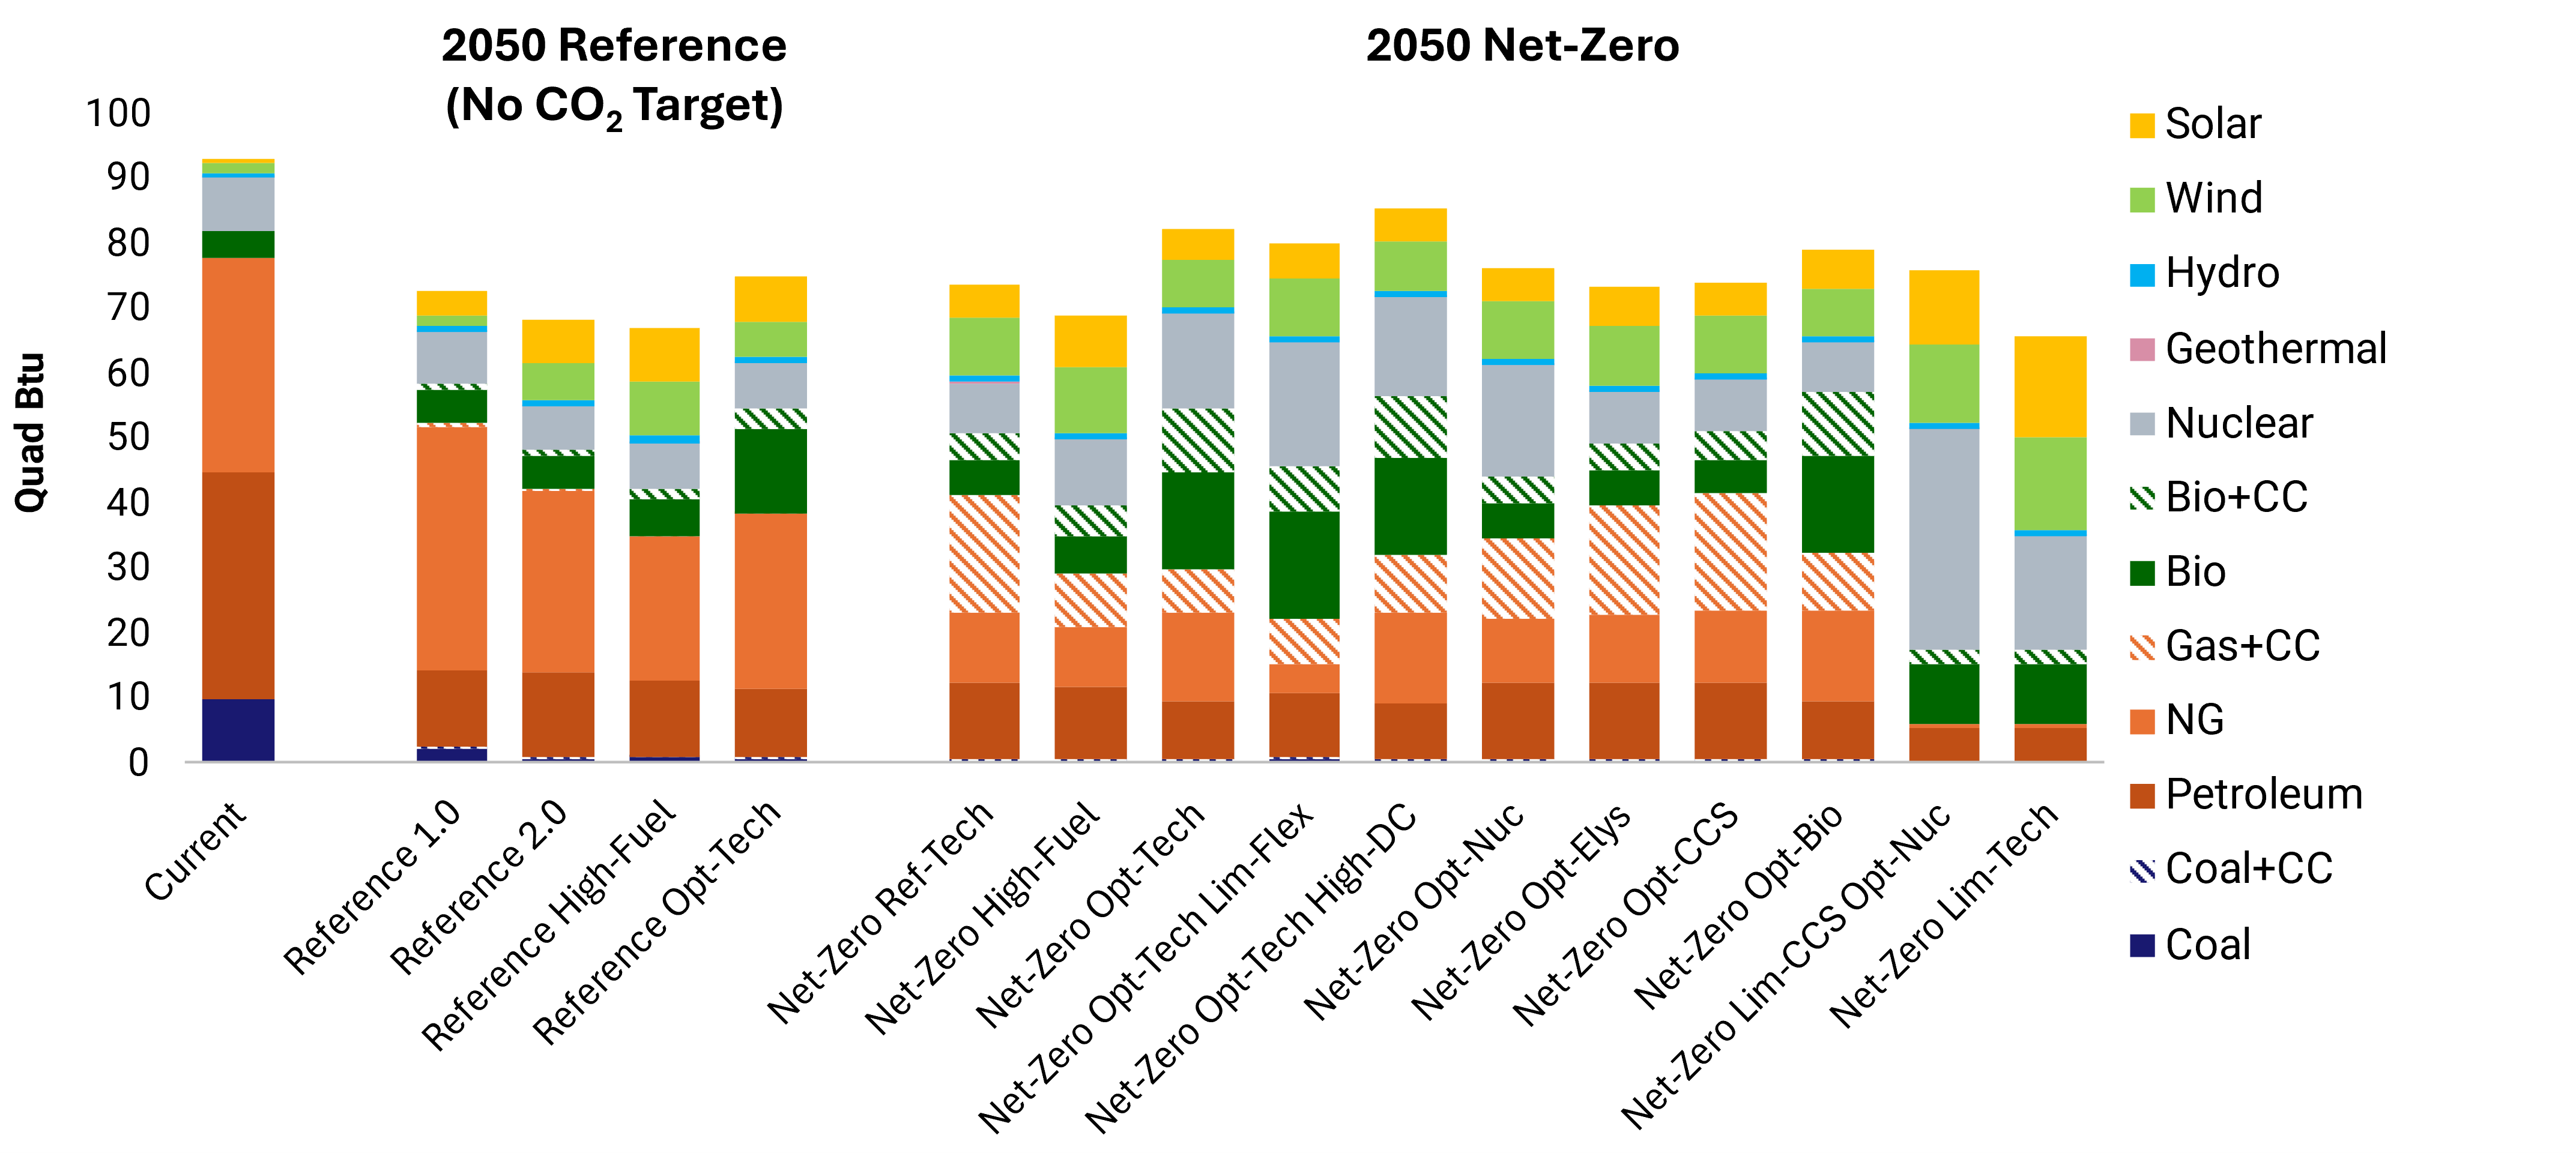
In the current energy system, fossil fuels supply 84% of primary energy, with the remainder provided by bioenergy, nuclear, and renewable sources (Figure 42). In future projections, both the total scale of primary energy and the fossil share decline, in part driven technological changes such as efficiency improvements, electrification, and cost reductions of renewable and other low-carbon technologies. Fuel prices and policy incentives also play a role in shifts away from petroleum and coal and towards natural gas. The net-zero scenarios examined in this study show a wide range of potential 2050 mixes consistent with achieving the economy-wide net-zero target. When CCS is available, fossil resources continue to contribute to a cost-effective solution, partly with carbon capture and partly with offsets from atmospheric removals. Still, the relative shares between fossil, bioenergy, nuclear, and renewables are sensitive to the uncertainties explored in the scenarios, in particular the costs of bioenergy and nuclear (for example, comparing the Net-Zero Ref-Tech scenario to the Net-Zero Opt-Tech, Opt-Nuc, and Opt-Bio scenarios). The total also varies despite fixed levels of end-use energy services across scenarios due to differences in the overall efficiency of alternative pathways. Without CCS, the shares of nuclear and renewables increase significantly with greater emphasis on direct and indirect electrification.
Final Energy by End-Use Sector

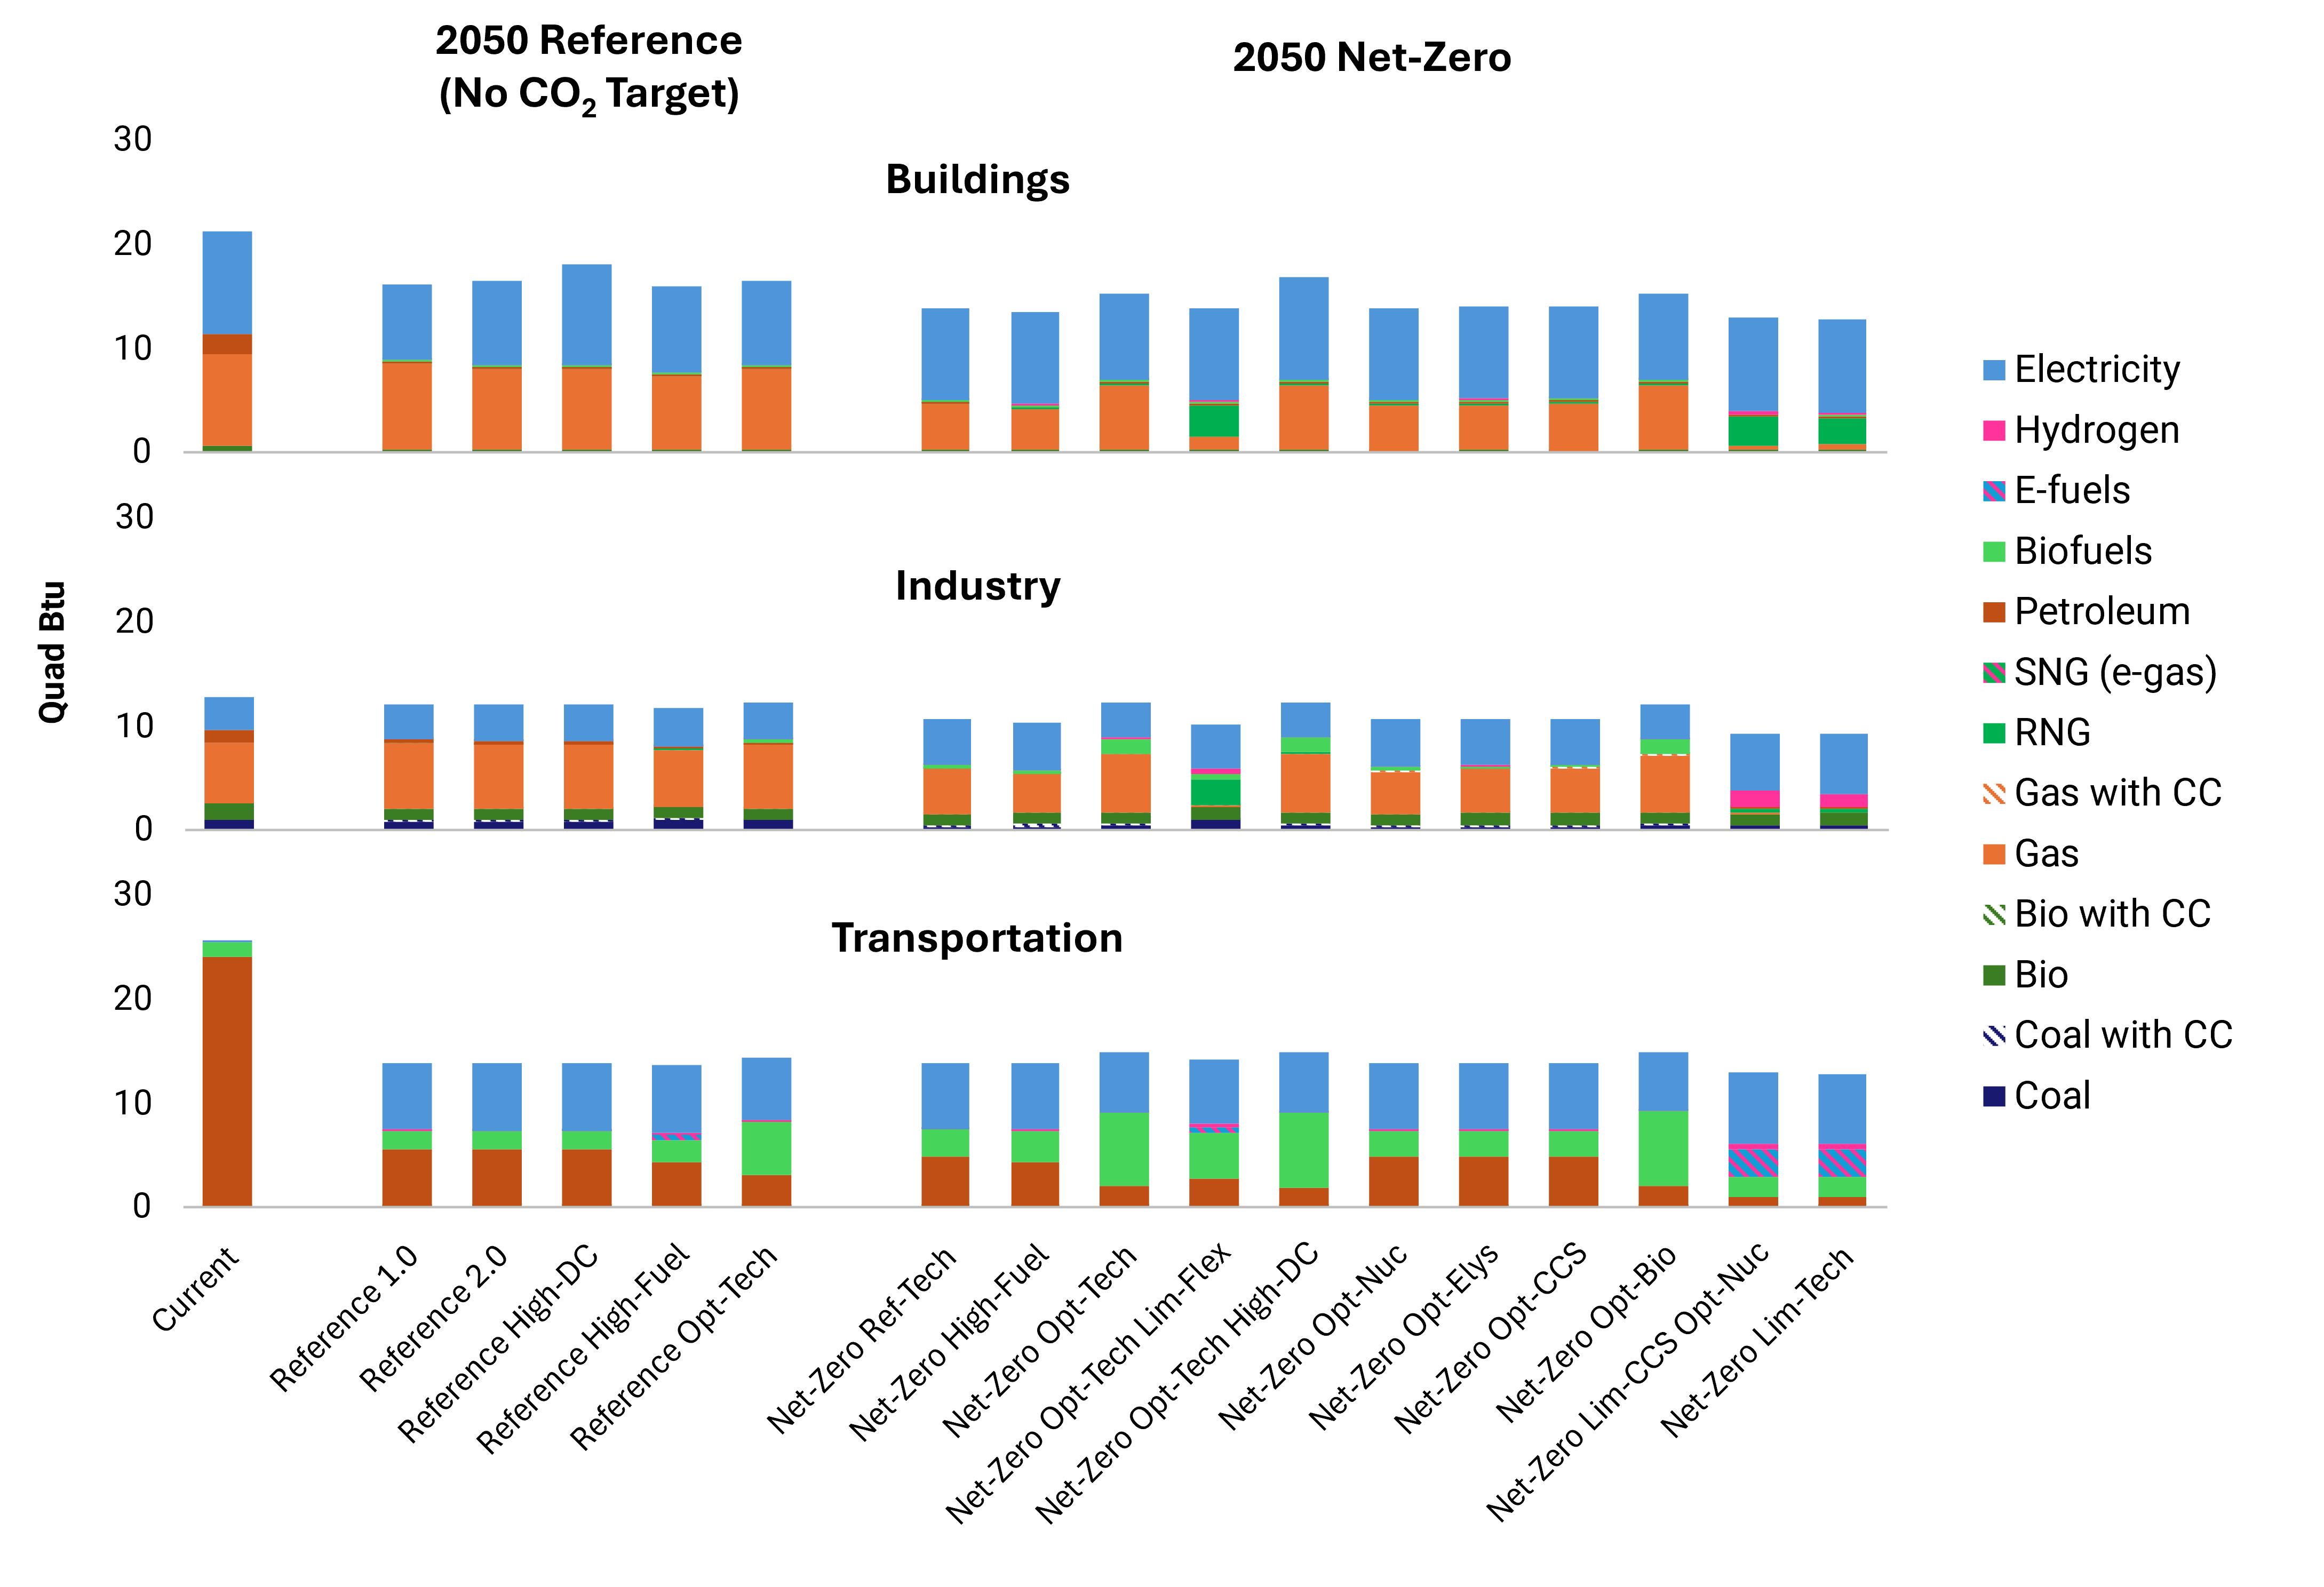
Final energy, or energy consumed by the end-user for the delivery of energy services such as space heating, industrial process heat, or mobility, is also projected to decline from current levels in all scenarios (Figure 43). This is especially true in transportation, where the electrification trend leads to much lower energy consumption due to the higher “tank-to-wheels” efficiency of electric vehicles compared to internal combustion engines. Electrification and efficiency also contribute to reductions in the buildings sector, where heat pumps are similarly more efficient at the end-use than conventional gas furnaces. In the industrial sector, growth in industrial output offsets efficiency improvements leading to roughly constant final energy demand over time, although endogenous investments in efficiency in some net-zero scenarios (particularly those with high marginal carbon and fuel prices) lead to lower industrial energy consumption.
The final energy mix across net-zero scenarios is sensitive to the costs of bioenergy and to fuel prices, both of which impact the extent of electrification. The mix is also highly sensitive to the flexibility of the target, that is, the ability to offset direct sectoral emissions with CDR offsets from elsewhere in the economy. When this flexibility is limited by technology or by policy, end-users rely more heavily on electrification and low-carbon fuels including renewable natural gas (RNG), hydrogen, and e-fuels (i.e. synthetic hydrocarbons), depending on the application.