Cost Metrics
Carbon Prices

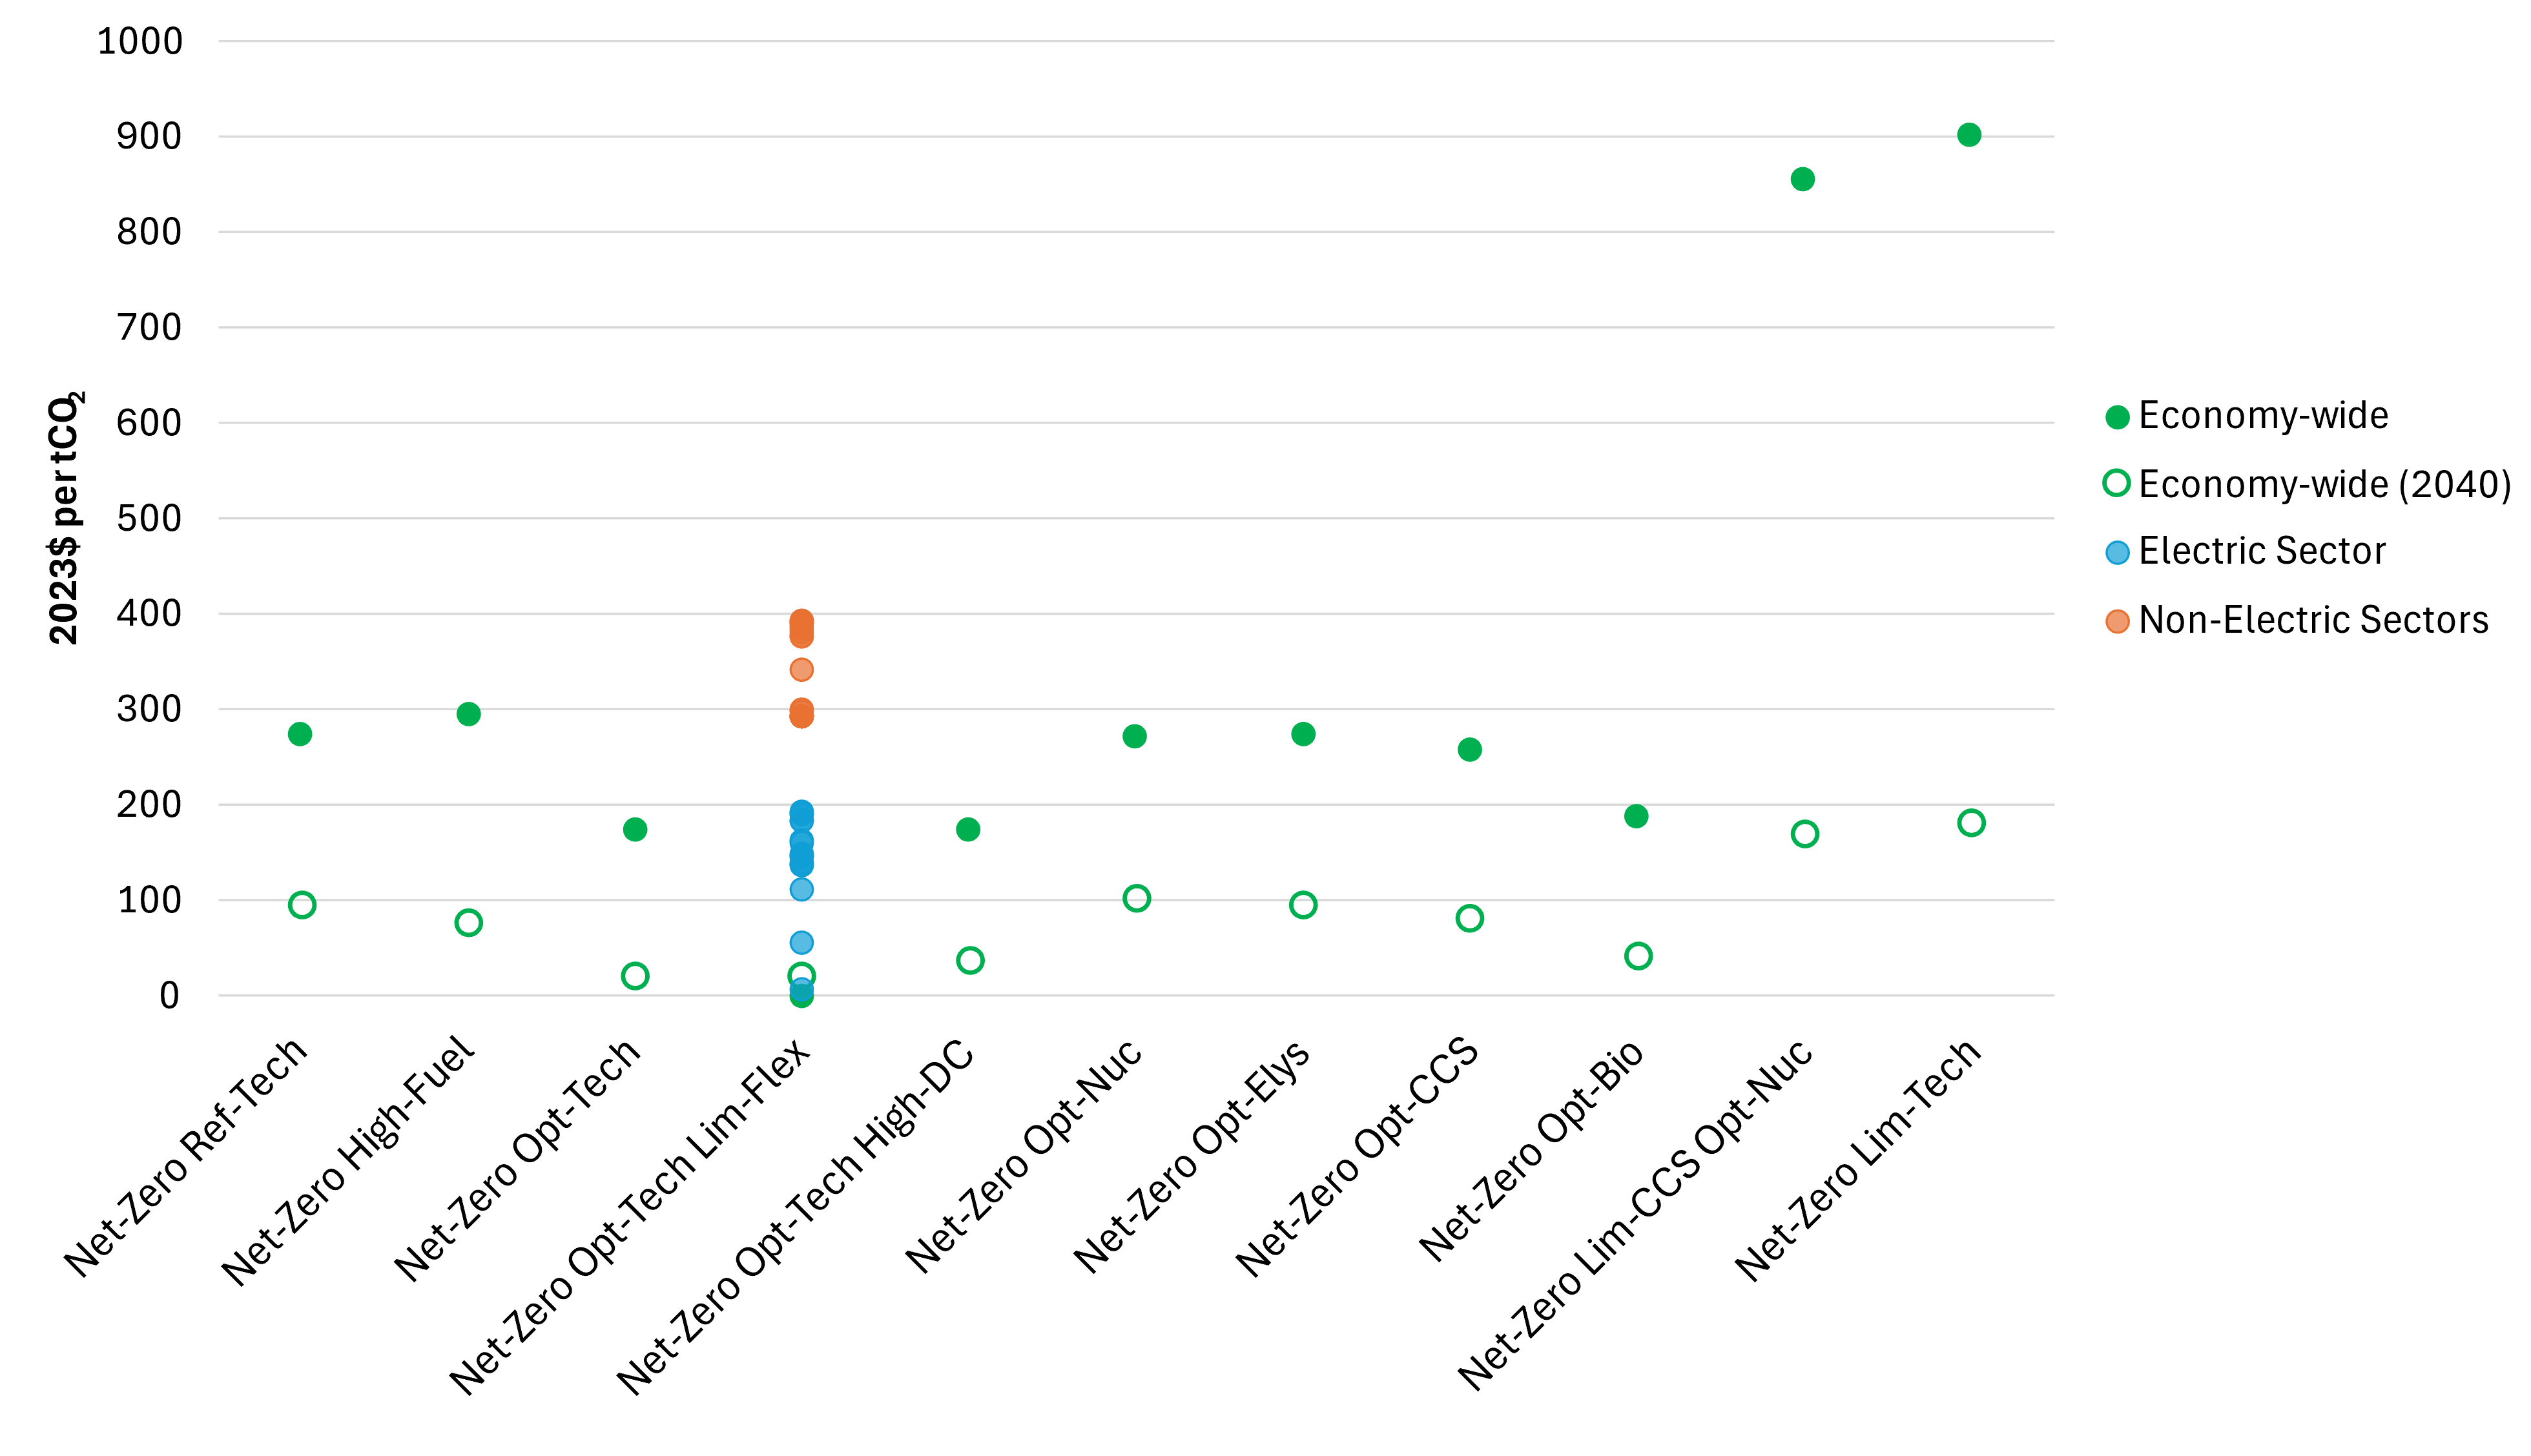
The net-zero scenarios in this analysis are modeled as an optimization under the imposed emissions constraint. With this framing, the model calculates an implicit shadow price on the constraint, reflecting the marginal cost of emissions reductions or the equilibrium price of an emissions credit under the cap. This carbon price metric is an indicator of the stringency of the cap given the costs and availability of technologies in the scenario. For most net-zero scenarios in this analysis, there is a single economy-wide emissions constraint. However, in the Lim-Flex scenario, the economy-wide cap is augmented by additional targets in each sector and region. This situation leads to a range of carbon prices corresponding to these additional constraints. Figure 12 shows the model’s calculated carbon price in 2050 across net-zero scenarios, with the economy-wide cap shown in green and the sectoral/regional caps in the Lim-Flex scenario shown in orange for non-electric sectors and blue for electric sectors. The economy-wide price in 2040 is also shown (open circles) to highlight the steep increase in marginal costs as the target declines from roughly 75% below 2005 in 2040 to 100% below (i.e. net-zero) in 2050.
The lowest economy-wide carbon prices, around $170/tCO2, occur in the scenarios with optimistic bioenergy assumptions, as these cases enable greater deployment of biofuels and associated CDR for lower cost. In scenarios with reference bioenergy assumptions and CCS available, the carbon price resolves to a higher level, around $270/tCO2, reflecting the assumed levelized cost (in 2050) for direct air capture, which is used in these scenarios to supplement CDR from bioenergy with CCS. In the scenarios without CCS, the marginal cost of achieving the target is much higher, as CDR options are constrained. In these scenarios, the carbon price is around $900/tCO2. In the Opt-Tech Lim-Flex scenario, the additional targets imposed on the non-electric sectors, particularly the buildings and industry sectors, are higher than the economy-wide price in the Opt-Tech scenario with full flexibility, while the electric sector’s price is lower in some regions and higher in others. Because the individual sectors’ targets are more binding than the economy-wide target in 2050, the economy-wide price goes to zero in this scenario.
Household Energy Expenditures

One way to frame total or average economy-wide costs of the energy system is in terms of expenditures on delivered energy. These costs are based on quantities consumed and retail prices in each end-use sector and reflect aggregate costs across production, conversion, storage, and delivery of electricity and non-electric fuels, including the premium reflected by the carbon price. Ultimately, all of these costs are incurred by households, but only energy for residential buildings and personal light-duty vehicles is purchased directly by households. Energy expenditures in the commercial, industrial, and other transportation sectors are embedded in the costs of goods and services and thus incurred indirectly by households as part of their non-energy consumption. For both direct and indirect energy expenditures, the total value across the economy can be normalized by the number of households to represent average per household energy expenditures. This metric is shown across scenarios in Figure 13. Note that there is significant variation across households around this average based on size, type, region, technology configuration, income level, and other attributes.
In the current energy system (based on 2022 data from EIA and expressed in year 2023 dollars), average per household direct energy expenditures are around $5,000 per year, while indirect expenditures (i.e. non-household energy purchases) amount to around $6,200 per year. Total energy expenditures in 2022 were around 5.2% of U.S. gross domestic product (GDP). In the reference scenario projections for 2050, direct household expenditures on electricity increase as a result of electrification, but overall expenditures are lower in both absolute terms and as a share of GDP. Efficiency, electrification, and technical and structural change all contribute to a reduction in the costs of the energy system. In the net-zero scenarios, 2050 energy expenditures are higher than in the reference scenario, but in most cases lower in absolute terms than current expenditures.