LCRI Net-Zero 2050: Sensitivity Analysis and Updated Scenarios
Executive Summary
As part of the Low-Carbon Resources Initiative (LCRI), EPRI and GTI Energy led an integrated energy system scenario modeling exercise in 2022 to evaluate alternative technology strategies for achieving economy-wide net-zero emissions of carbon dioxide (CO2) in the U.S. by 2050. The Net-Zero 2050: U.S. Economy-wide Deep Decarbonization Scenario Analysis provided insights on potential pathways and technology trade-offs based on three scenarios around costs and availability of key resources.
Building on this study, the LCRI has developed an updated analysis – Net-Zero Scenarios 2.0. This update reflects a broader range of technology sensitivity cases, as well as an expanded set of drivers reflecting recent developments, including evolving policy incentives and regulations and emerging trends in data center electricity use. The broader scenario space in this update provides additional insights into the timing, trajectory, and technologies to achieve net-zero goals, as well as updated reference cases. In the updated analysis, all scenarios include U.S. Inflation Reduction Act (IRA) incentives, new U.S. Environmental Protection Agency (EPA) power plant rules (as specified at the time of publication in December 2024), and accelerated load growth associated with data center development. The sensitivity analysis includes varying technology availability and cost assumptions for advanced nuclear, electrolysis, carbon capture and storage, and bioenergy. Additionally, the updated scenarios assess the implications of fuel price uncertainty and limited flexibility in how far individual sectors and regions are required to reduce direct emissions under an economy-wide target. Table ES-1 defines the scenarios and labels used in the report.
| Scenario | Description |
|---|---|
| Reference 1.0 | Reference with state and federal policies as of 2022 |
| Reference 2.0 | Reference updated with IRA, new EPA 111(b) and 111(d) rules, and data center load growth (low scenario) – these assumptions are included in all subsequent scenarios |
| Reference High-DC | Updated reference case with high data center growth (only shown for emissions and electricity results) |
| Reference High-Fuel | Updated reference case with high oil and gas prices |
| Reference Opt-Tech | Updated reference with optimistic assumptions for advanced nuclear, CO2 transport and storage, electrolysis, and bioenergy |
| Net-Zero Ref-Tech | Economy-wide net-zero target for 2050 with reference assumptions for advanced nuclear, CO2 transport and storage, electrolysis, and bioenergy |
| Net-Zero High-Fuel | Net-zero target with reference technology assumptions and high oil and gas prices |
| Net-Zero Opt-Tech | Net-zero target with optimistic assumptions for advanced nuclear, CO2 transport and storage, electrolysis, and bioenergy |
| Net-Zero Opt-Tech High DC | Net-zero target with optimistic technology plus high scenario for data center load growth |
| Net-Zero Opt-Tech Lim-Flex | Net-zero target with optimistic technology plus regional net-zero targets and sectoral caps on positive emissions (limited carbon market flexibility) |
| Net-Zero Opt-Nuc Net-Zero Opt-Elys Net-Zero Opt-CCS Net-Zero Opt-Bio | Net-zero target with optimistic assumptions for each respective technology and reference assumptions for other technologies |
| Net-Zero Lim-CCS Opt-Nuc | Net-zero target with optimistic assumptions for advanced nuclear and electrolysis, reference assumptions for bioenergy, and no CO2 storage allowed |
| Net-Zero Lim-Tech | Net-zero target with reference assumptions for advanced nuclear, electrolysis, and bioenergy, and no CO2 storage allowed |
High-Level Findings Reinforce Previous Takeaways
In the updated scenarios, model results support many of the key takeaways from the initial analysis, such as:
Clean electricity, efficiency, and electrification are central to an affordable and reliable decarbonization strategy. All scenarios have an increased pace of new electric generation capacity additions, including both variable renewables and clean firm capacity. Existing low-carbon resources – such as nuclear, renewables, and energy storage, serve as key building blocks.
Grid modernization and investment in electricity transmission and distribution capacity are crucial to support the energy transformation. New capacity, especially variable renewables, and electrification will require new connections across and within regions.
Pipeline gas infrastructure is important to enable long-term reductions. All scenarios continue to rely on gas capacity to meet peak service demands, often with an evolving fuel mix and lower capacity factor.
Technology optionality – the ability to use all resources at our disposal – enables affordability. Expanding the set of options available to achieve net-zero goals leads to lower overall costs for a reliable energy system.
Low-carbon fuels help fill reduction gaps across power generation and hard-to-electrify applications. Fuel pathways based on hydrogen and bioenergy complement a decarbonized electric sector in key applications such as dispatchable power, high-temperature process heat, and heavy-duty transport.
Maintaining the flexibility to account for regional differences in developing decarbonization pathways is essential to affordability and reliability. The roles of different technologies, electrification, and gas vary greatly by region.
These findings are consistent with the emerging literature on reaching net-zero emissions in the U.S. See for example Bistline, et al. (2024), Browning, et al. (2023), and LCRI's inter-model comparison of net-zero studies.
The updated scenarios also introduce and expand on several new insights.
Decarbonization Strategies Vary Across the Economy
Achieving economy-wide net-zero goals requires deployment of low-carbon technologies across electric and non-electric sectors, including industry, fuels, buildings, and transportation. The potential for direct emissions reductions varies across sectors, and optimal strategies vary within each sector depending on technology costs and availability (Figure ES-1). In most net-zero scenarios, power sector emissions are near-zero by 2050, though some positive emissions can remain for infrequently used balancing resources. In the non-electric sectors, direct emissions reductions in net-zero scenarios span a broader range. In general, the buildings, industry, and fuels sectors achieve lower percentage reductions than the power and transportation sectors, reflecting their higher marginal abatement costs. Electrification and low-carbon fuels can substitute for conventional fuels to reduce emissions, but the marginal costs can rise steeply for some end-uses (such as space heating in cold climates and high-temperature industrial processes). Carbon dioxide (CO2) removal (CDR) from bioenergy with carbon capture and storage (CCS), direct air capture (DAC), and natural processes such as afforestation provide cost-effective options to offset emissions that would be the most expensive to reduce directly.

Technology Uncertainty Illustrates the Value of Optionality
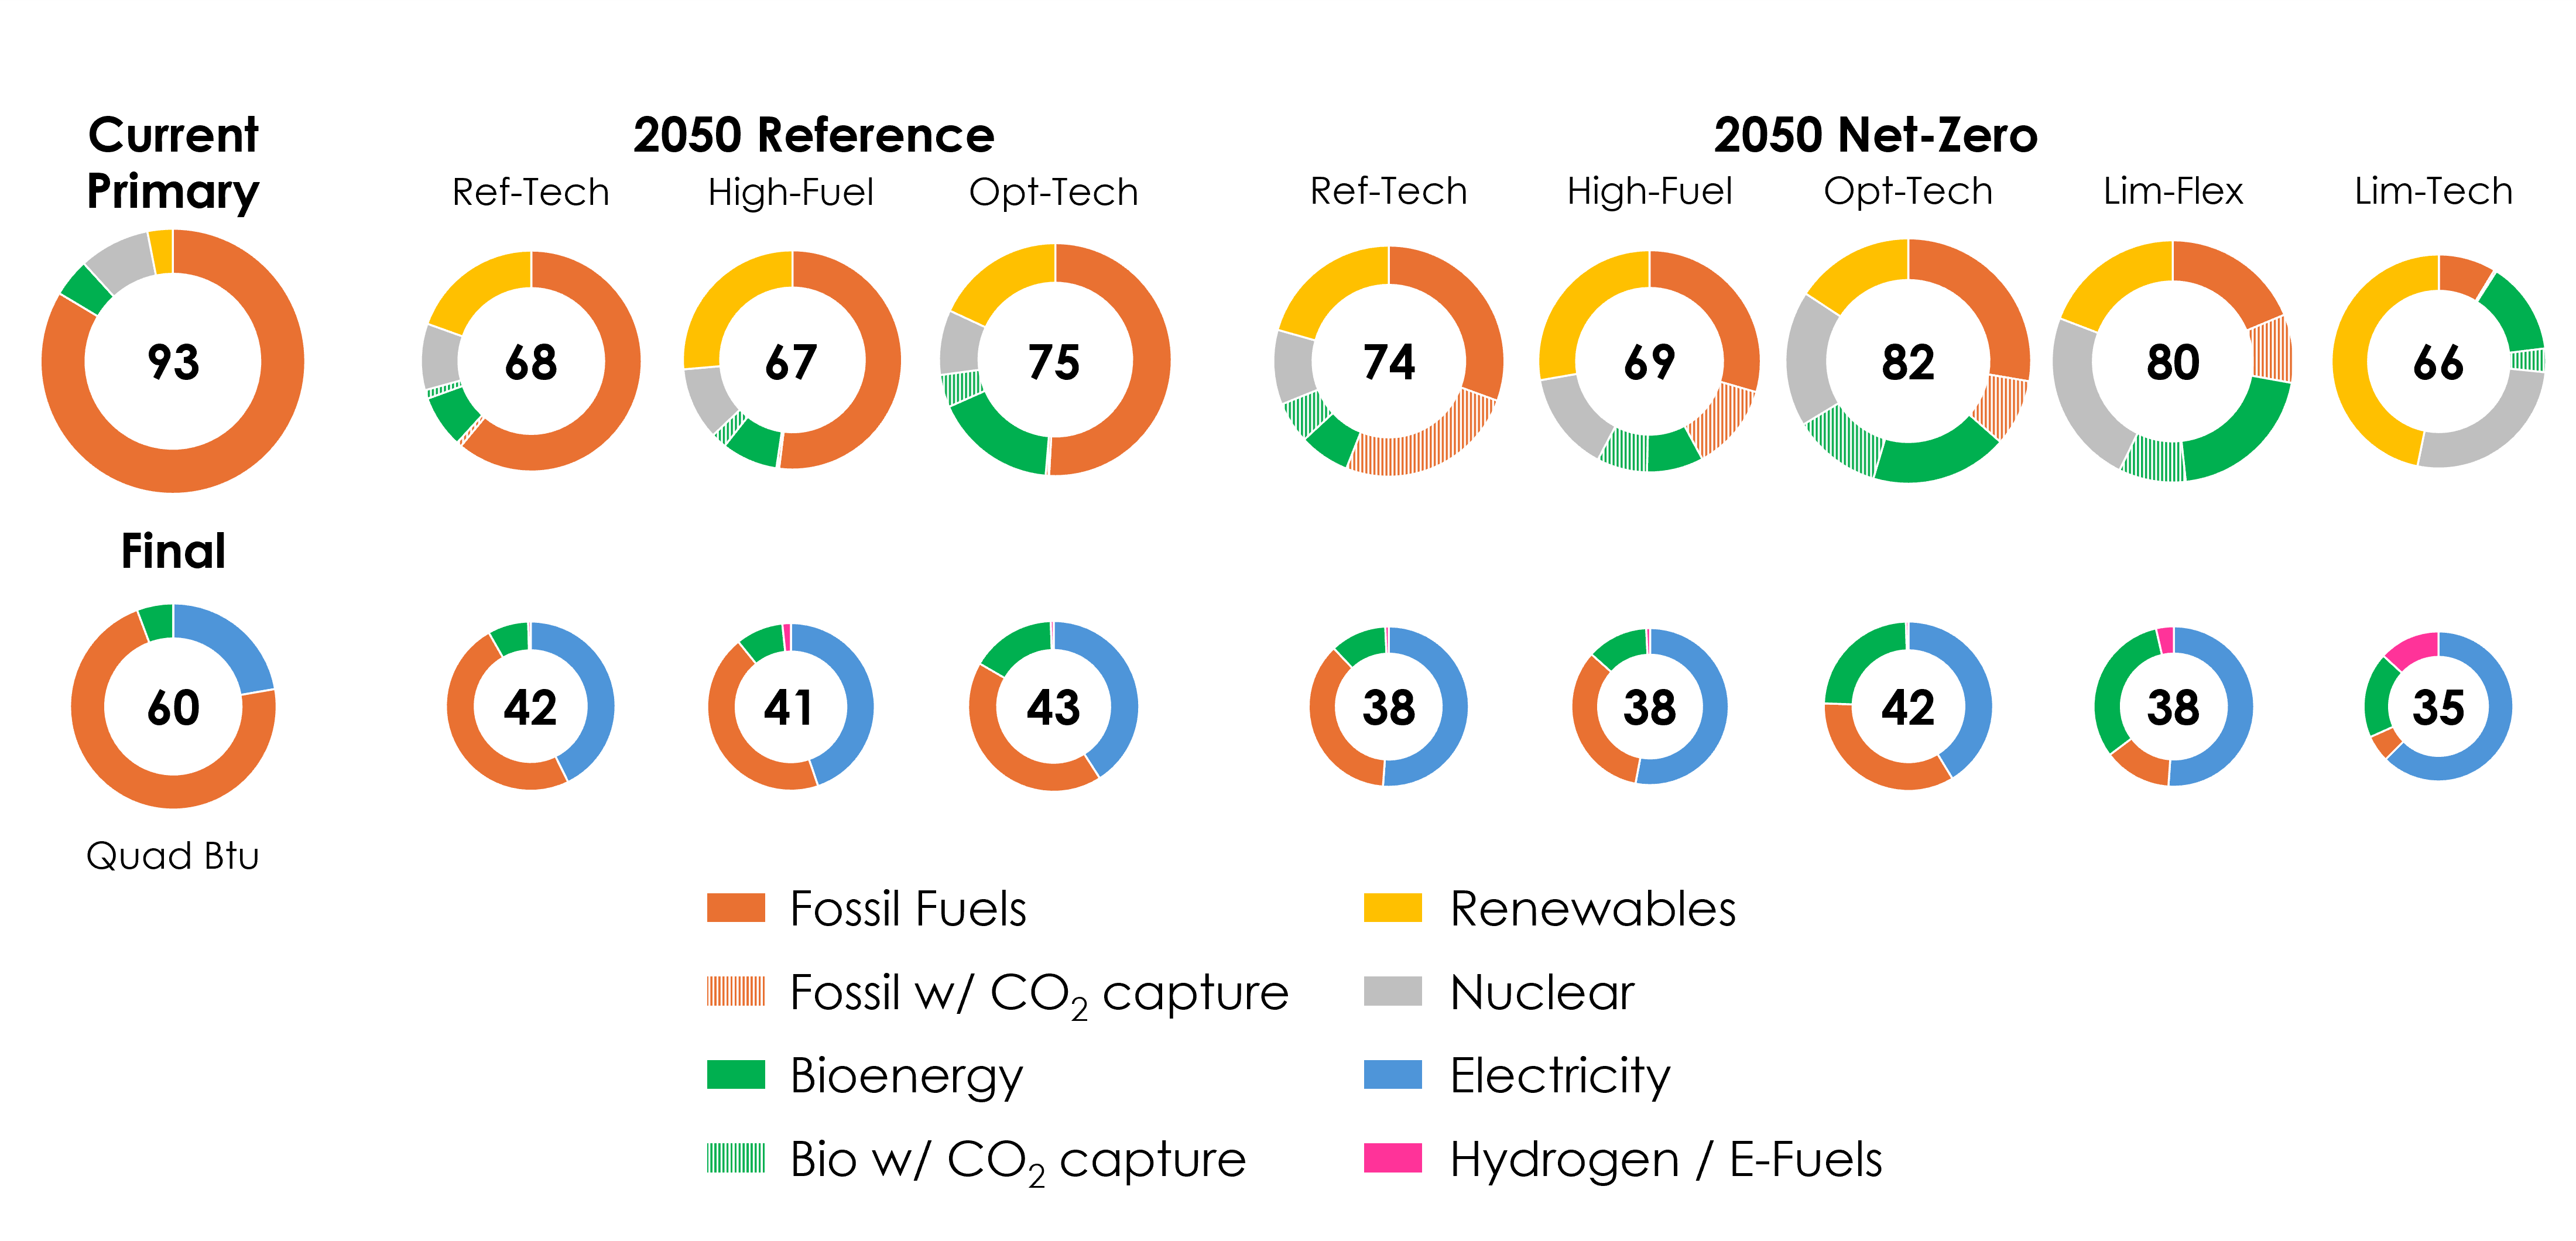
The least-cost resource mix for a reliable net-zero energy system varies depending on assumed technology development timeframes and costs (Figure ES-2). For example, the roles of nuclear and electrolysis are sensitive to both their own and other technology costs, and their importance is amplified when CCS is limited. The availability of low-cost bioenergy impacts both electrification and low-carbon fuel trade-offs, as well as carbon management options. For example, CO2 removal (CDR) via direct air capture and storage is only cost-effective in a scenario where limited bioenergy increases the costs and restricts the supply of CDR from biofuels with CCS.
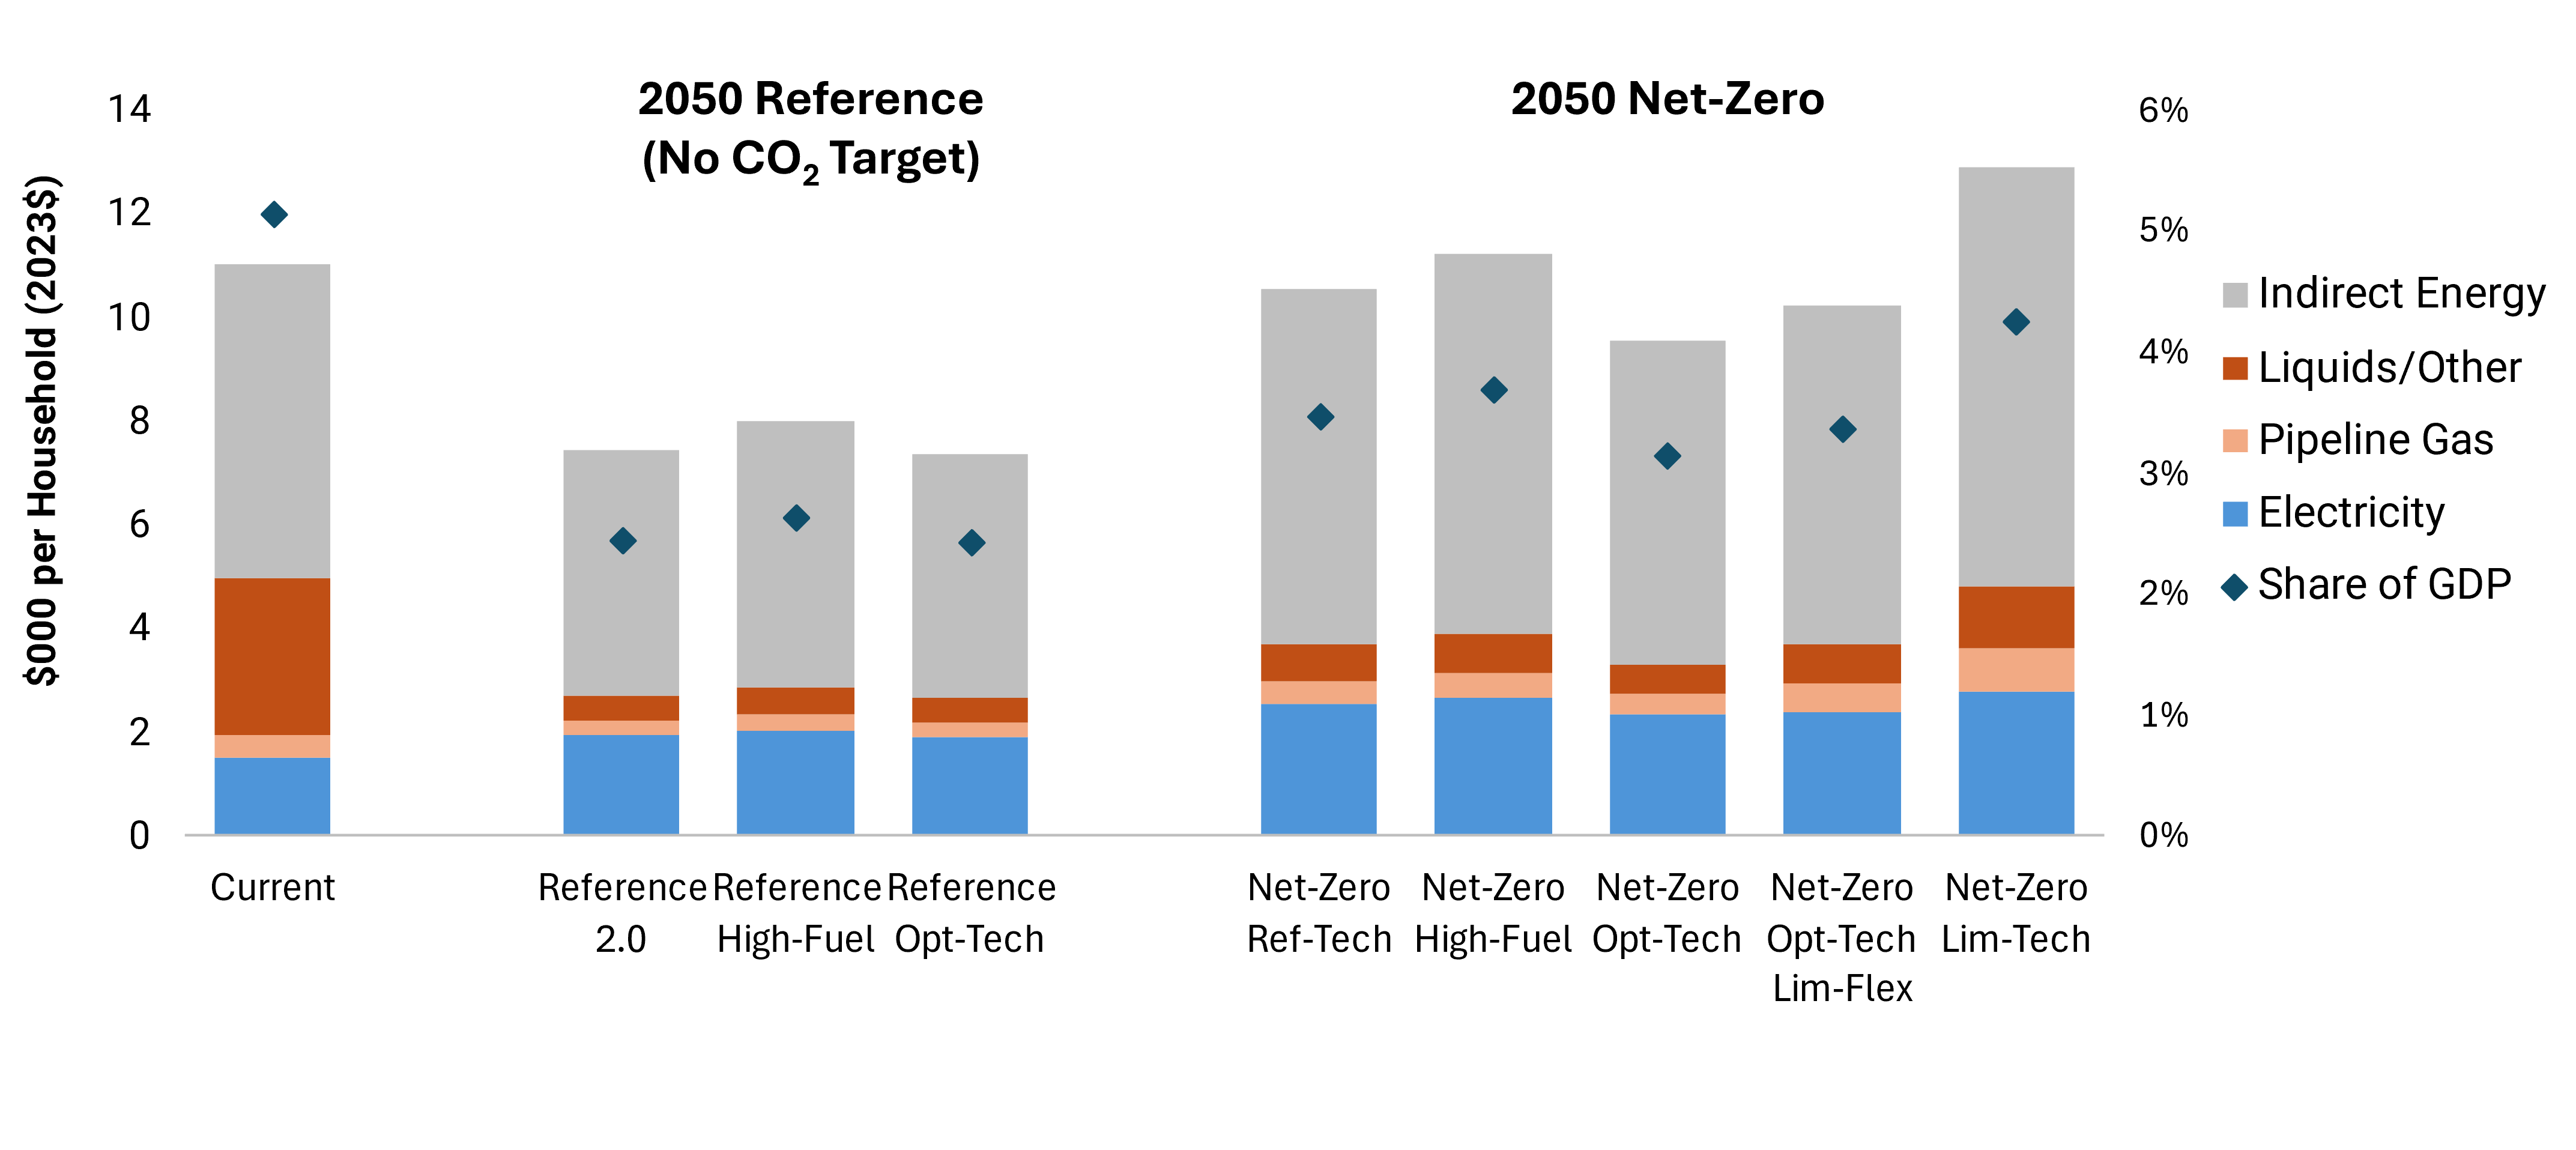
Limited carbon market flexibility also leads to a less efficient (i.e. more costly) allocation of emissions reductions and less deployment of CDR options. This scenario illustrates the impact of individual sectors driving their direct emissions lower using low-carbon fuels such as renewable natural gas (RNG) and hydrogen. When either technology or market flexibility is limited, the costs of delivered energy incurred directly and indirectly by households are higher (Figure ES-3). These results reinforce the value of optionality to improve the affordability of net-zero pathways.
In all scenarios, final energy, or energy delivered to end-users, declines relative to current levels as efficiency gains from technological improvement and electrification more than offset service demand growth (Figure ES-2). In most scenarios, this translates to lower household energy expenditure on energy (inflation-adjusted) relative to today, although net-zero systems have higher costs than comparable reference cases (Figure ES-3). However, electricity use and electricity expenditures increase over time despite the overall decrease due to the rising share of electricity in the final energy mix.


Growing Electricity Demand Drives New Capacity
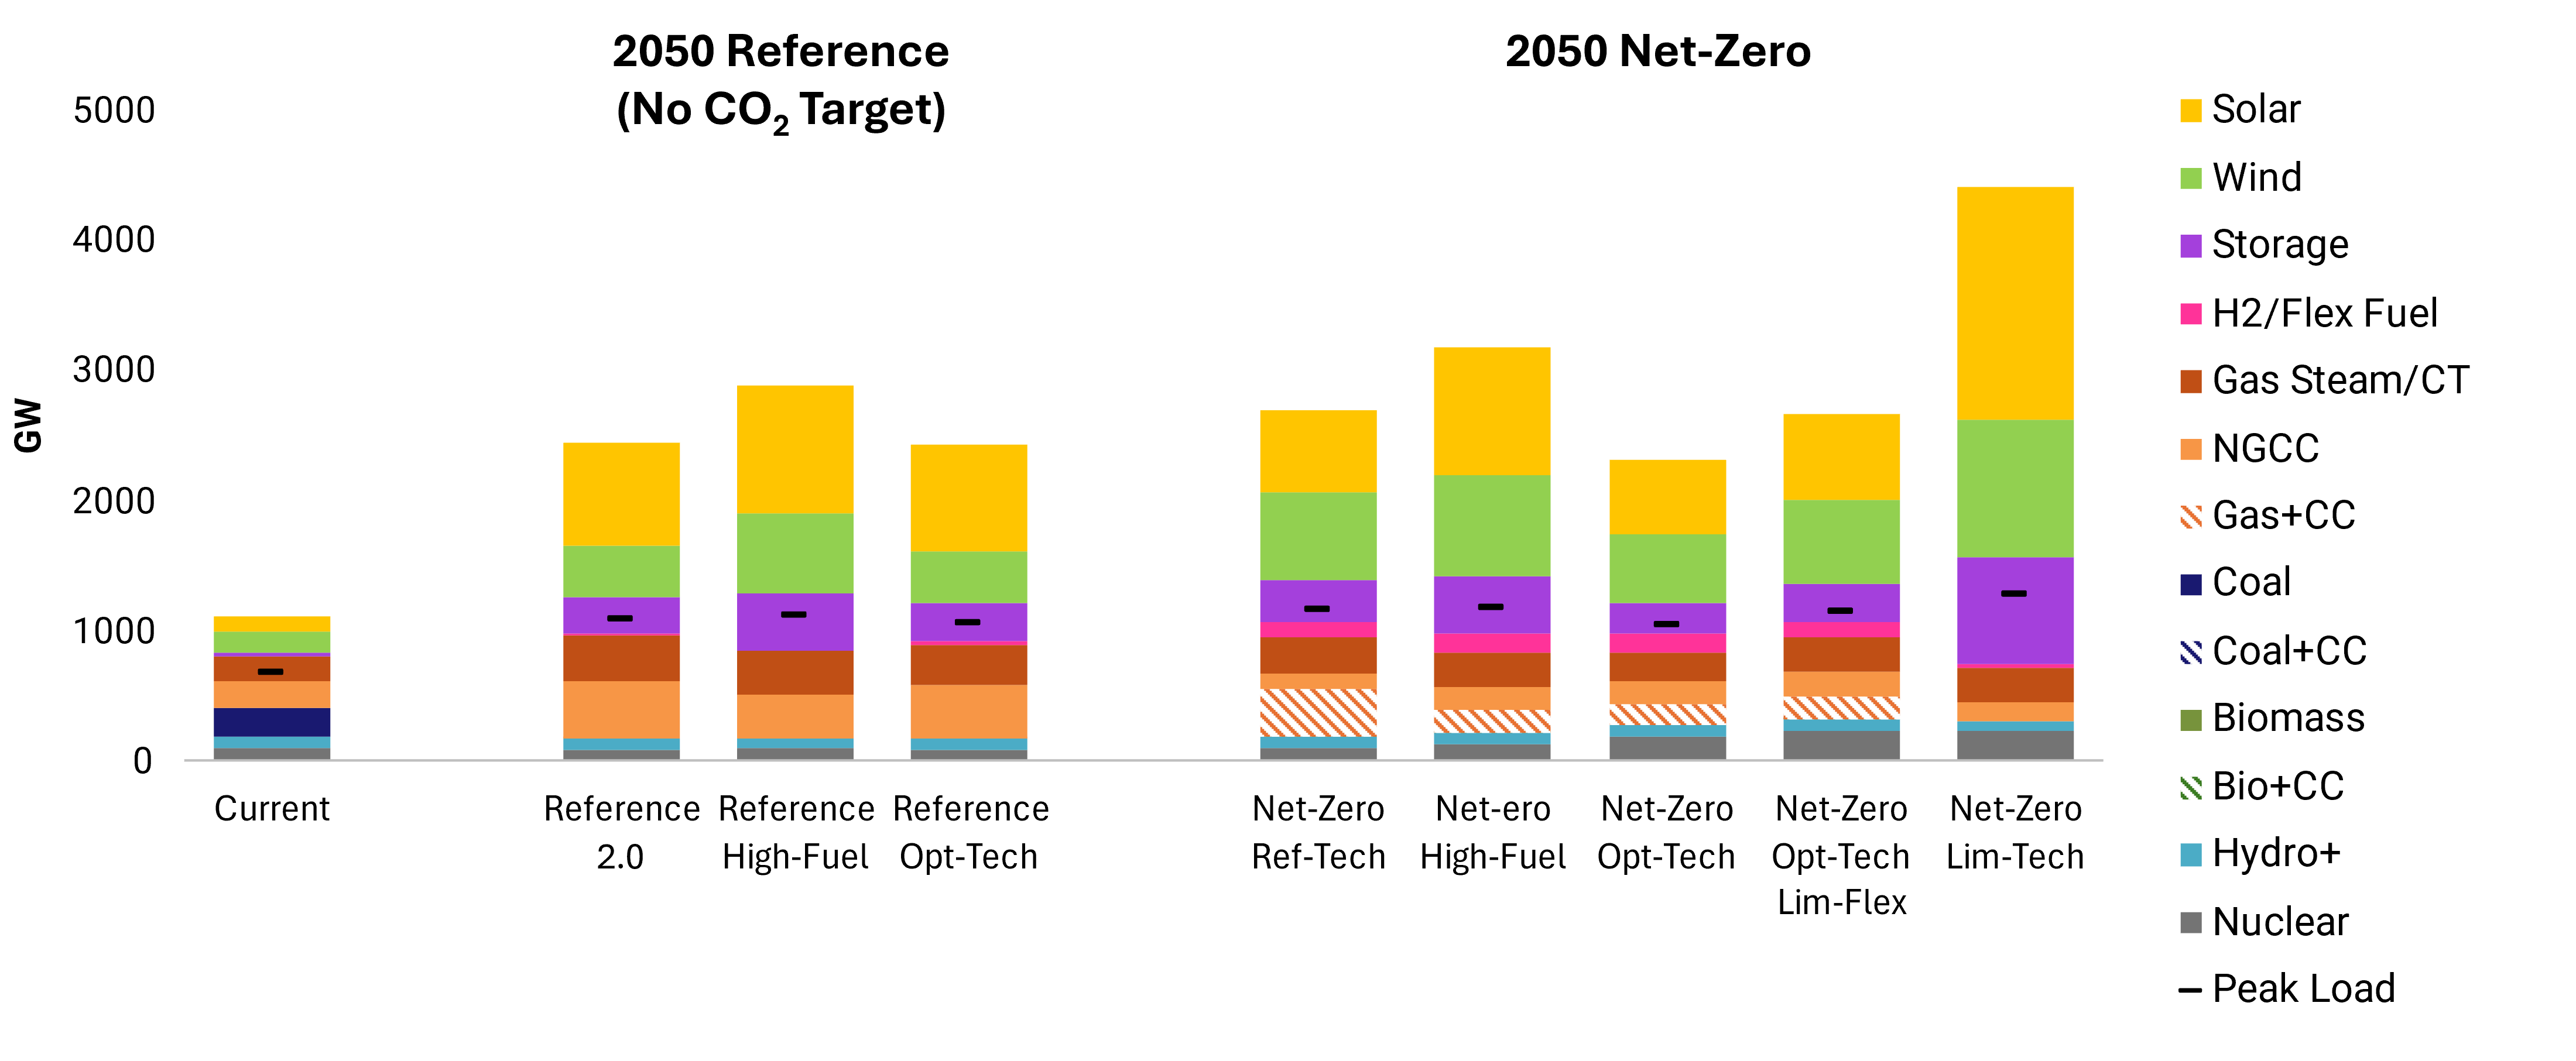
The rapid proliferation of data centers to support growing demand for computing services such as generative artificial intelligence (AI), along with trends in end-use electrification, electrolytic hydrogen, and other loads, is creating new pressure to expand the generation fleet in the next five to 10 years (Figure ES-4). Meeting this demand means accelerating technology development and deployment, relying on a portfolio of available resources to meet growing energy needs over the next decade. While higher data center load may imply an increase in new gas capacity and near-term emissions, in the longer run low-emitting resources are deployed to meet growing load across the economy (from data centers and other sources) under a net-zero target. New gas capacity remains an important firm resource for balancing variable renewables going forward, even as capacity factors decline with deeper decarbonization, and continues to play a role in net-zero systems with carbon management and low-carbon fuel flexibility (Figure ES-5).


IRA Incentives and EPA Power Plant Rules Spur Near-Term Technology Development
As energy companies invest in their systems to meet growing demand, the analysis finds that the combined effects of IRA incentives for deployment of renewables, nuclear, carbon capture, and hydrogen and EPA regulations placing new restrictions on coal- and gas-fired generation lead to increased adoption of low-carbon resources and lower emissions in the decade ahead. These factors drive wind, solar, energy storage, and electrolysis development in particular, although electrolysis power demands are sensitive to the expiration of IRA's 45V clean hydrogen credits.
Interpreting Modeling Results
This updated analysis examines how demand growth, technology development, government incentives, and environmental regulation could impact progress toward net-zero goals. While actual outcomes will likely differ from any modeled scenario, the analysis offers actionable insights to help inform decision-making for stakeholders aiming to balance environmental goals with improved electricity reliability, affordability, and resilience in the years and decades ahead.