

Overview and Emissions

Economy-wide CO2 emissions in the U.S. decline in all scenarios, continuing the historical trend observed since 2005. Figure 9 shows the time path of modeled emissions across scenarios and highlights several of the key drivers. In the Reference 1.0 scenario, which excludes IRA and the recently finalized EPA power plant rules, emissions decline due to electrification, especially in transportation, state and other policy targets, and technical change improving efficiency and reducing costs of renewable, battery, and other technologies. Comparing this trajectory to the Reference 2.0 scenario illustrates the modeled impact of the IRA and EPA rules, which further reduce emissions through induced deployment of subsidized clean technologies and carbon capture and accelerated retirement of existing coal-fired generation. At the same time, increased data center load growth in the updated reference scenarios can result in higher emissions in the near-term. With higher fuel costs or more optimistic technology improvements, reference emissions decline further.
The red line in Figure 9 shows the target applied to economy-wide net emissions in the net-zero scenarios, starting with 3.2 GtCO2 in 2030 and declining linearly to zero in 2050. In general, reference scenario emissions do not reach this target in any time period, except in 2030 and 2035 in the Reference Opt-Tech scenario. Apart from this exception, achieving the target in 2030 requires a marked departure from the reference emission trends. However, because of the effects of the IRA incentives and EPA rules in the 2035 timeframe and the anticipation of subsequently more stringent targets in the ensuing decade, emissions in most net-zero scenarios fall below the target in 2035. Only in the Lim-Tech cases is the target binding in 2035. In 2040 and beyond, a larger gap emerges between the reference cases and the net-zero target, and the economy-wide constraint is binding in all net-zero scenarios during this period.

Although net emissions reach zero by 2050, direct positive emissions are not entirely eliminated in any scenario, as they are offset to varying degrees by CO2 removal (CDR) options (Figure 10). In general, the model identifies the least-cost combination of direct reductions and deployment of CDR technologies to meet the target balance between positive and negative emissions. Under this strategy, more expensive direct reductions are avoided when a less expensive CDR option is available. Positive emissions remain in sectors where the marginal cost of substituting away from fossil fuels is highest, including building heating in cold climates, high-temperature industrial heat, and certain transportation segments such as aviation. The range of scenarios in this analysis demonstrate how this balance can depend on uncertain technology and policy variables. With optimistic assumptions about bioenergy and CCS, there is more deployment of biofuels for both CDR and replacement of petroleum-based liquid fuels in transportation. With more pessimistic assumptions about bioenergy costs and availability, there is less substitution away from petroleum in non-electrified transportation segments, and direct air capture (DAC) is used to provide CDR offsets, albeit at a higher cost, leading to greater direct reductions in buildings and industry. When flexible allocation of emissions reductions across sectors is limited by sectoral and regional targets, direct positive emissions are forced lower, leading to less demand for CDR but higher marginal costs. When CCS is unavailable and the scale of CDR is limited to around 300 MtCO2 from natural land-based offsets, direct positive emissions must be eliminated wherever possible, remaining only in certain industrial activities such as chemicals and cement where non-fossil alternatives are not considered. In these scenarios, positive emissions are reduced to around 95% of 2005 levels, but marginal costs of achieving the net-zero target approach $1000/tCO2.
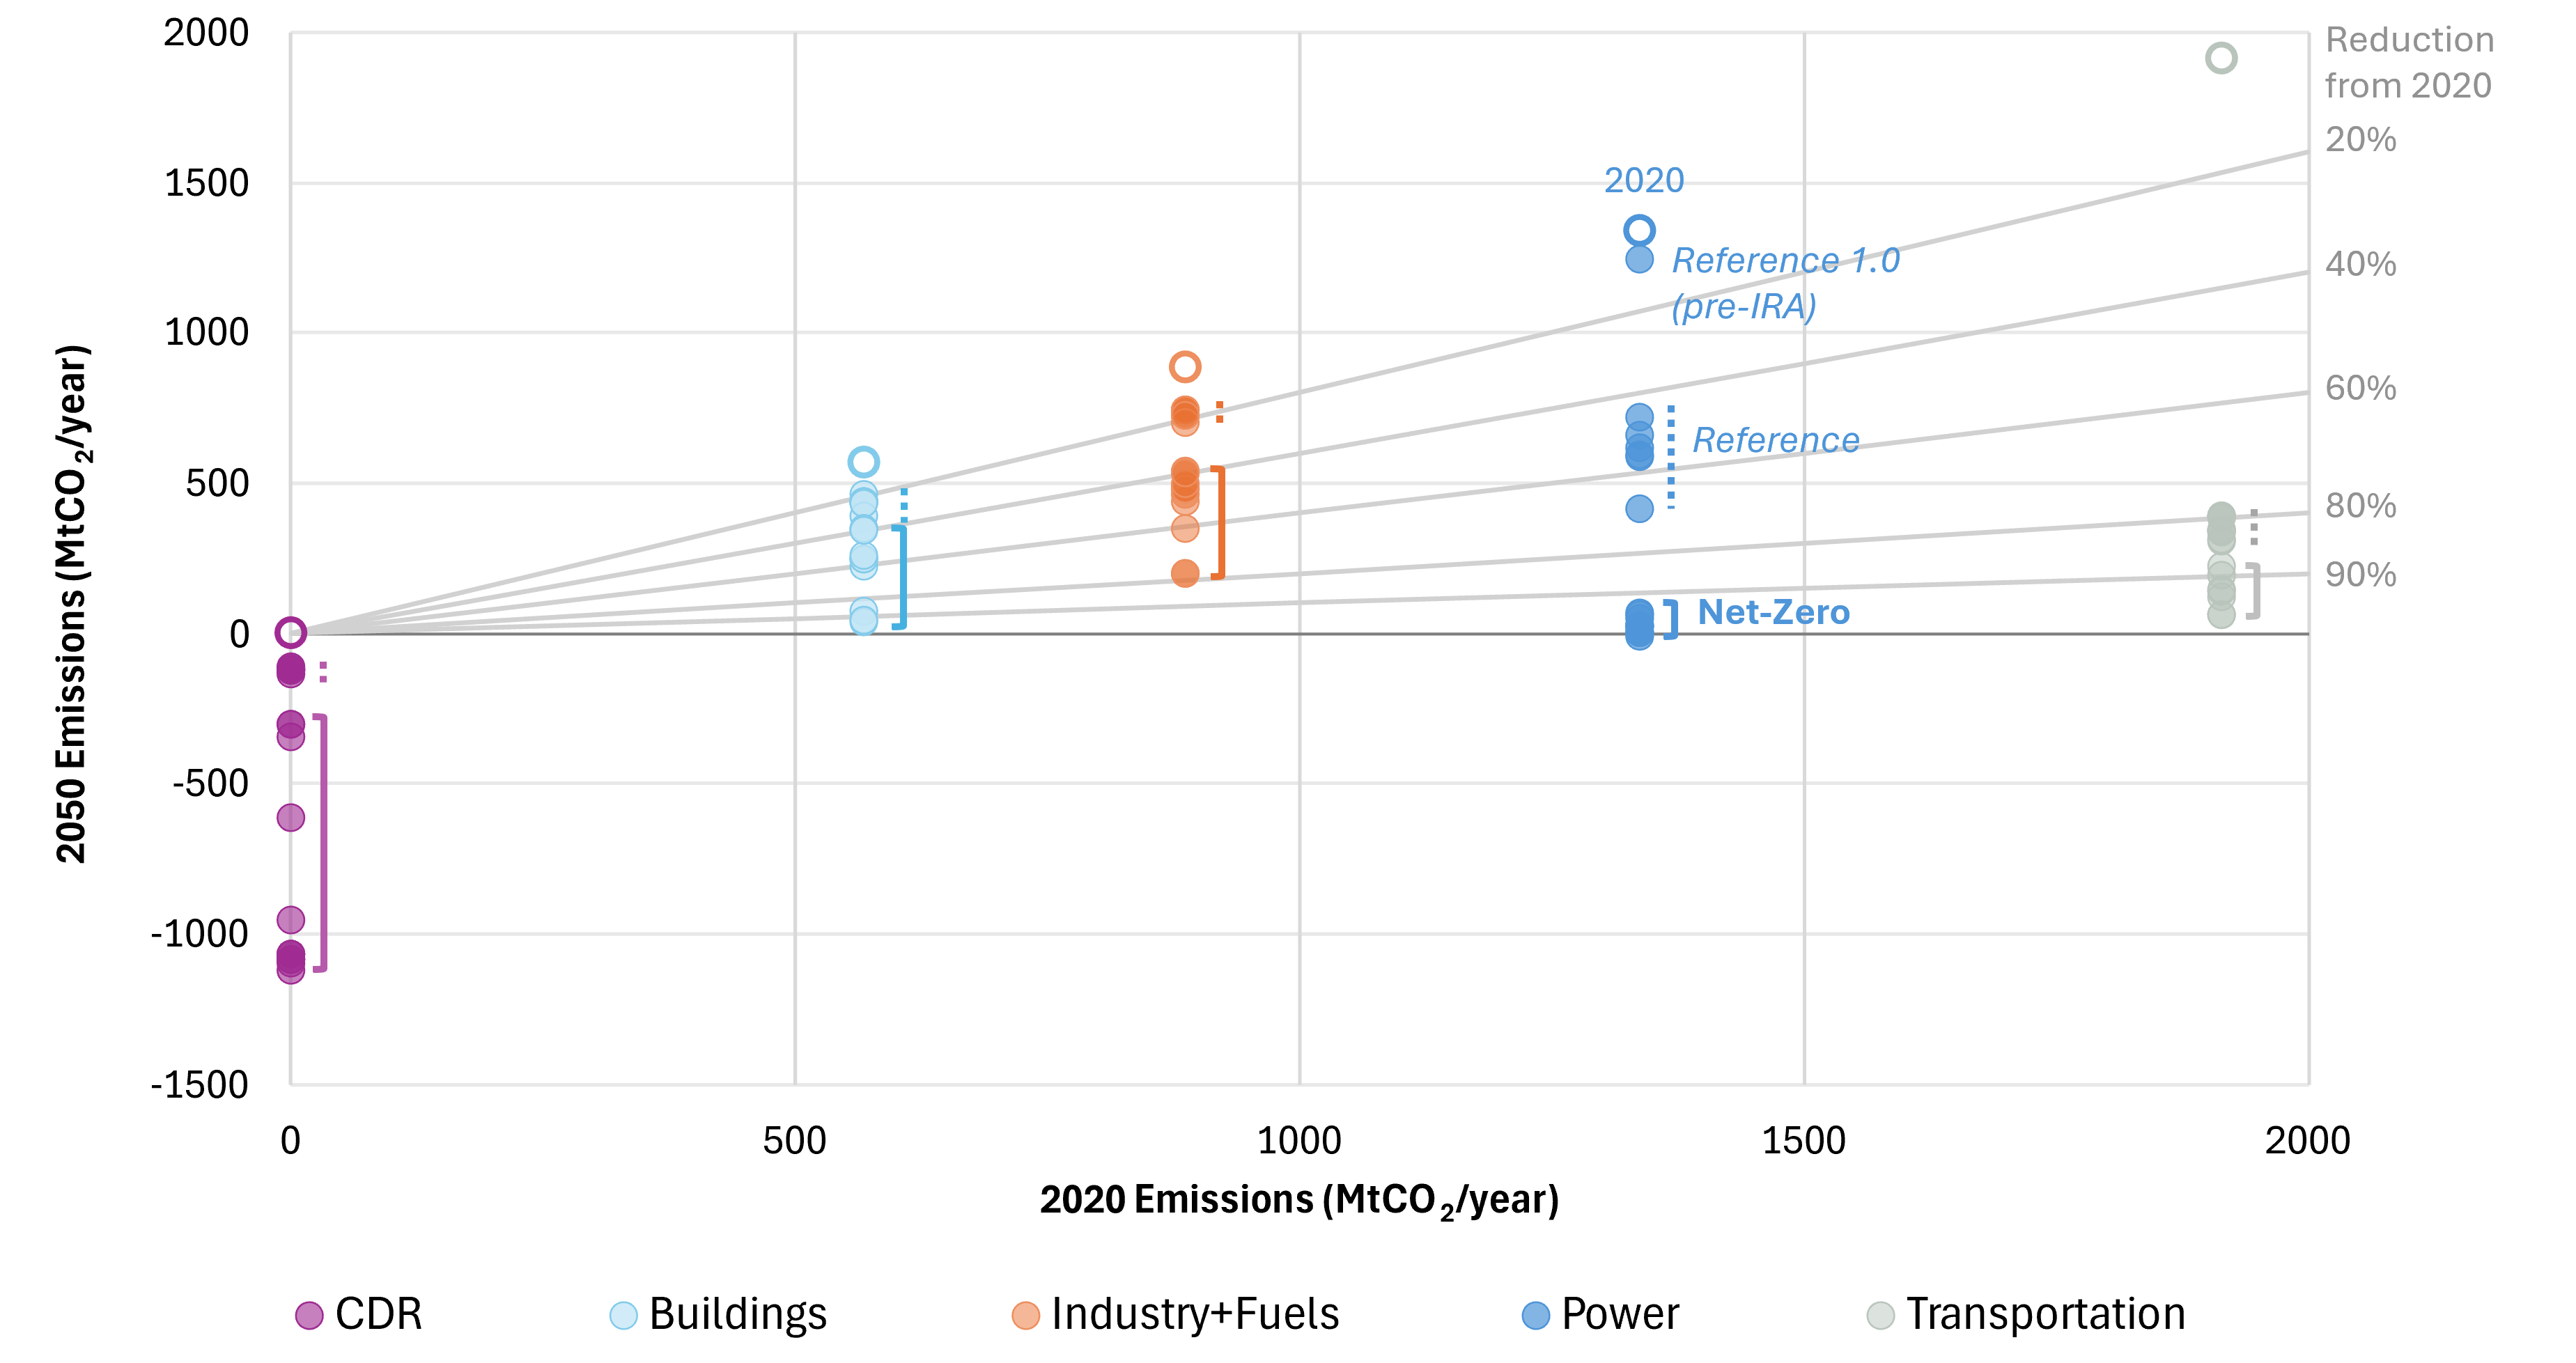
Figure 11 shows direct sectoral emissions in the context of reductions relative to 2020 across scenarios. In general, the buildings, industry, and fuels sectors achieve lower percentage reductions than the power and transportation sectors, reflecting their higher marginal cost of abatement. Most direct emissions in these sectors are related to natural gas use, which has higher substitution costs with electrification and low-carbon fuels than petroleum-based liquid fuels in the transportation sector. Power sector emissions vary significantly across reference scenarios, as the IRA and EPA rules omitted in the Reference 1.0 scenario are primarily focused on power sector emissions. Meanwhile, power sector emissions are near-zero in all net-zero cases, although not absolutely zero, as a small amount of gas use remains as a balancing option for variable renewable generation. The transportation sector exhibits deep reductions in the reference scenario due to electrification of most on-road segments driven by favorable economics with cost and performance improvements of battery electric vehicles.